Get details of current and past connections
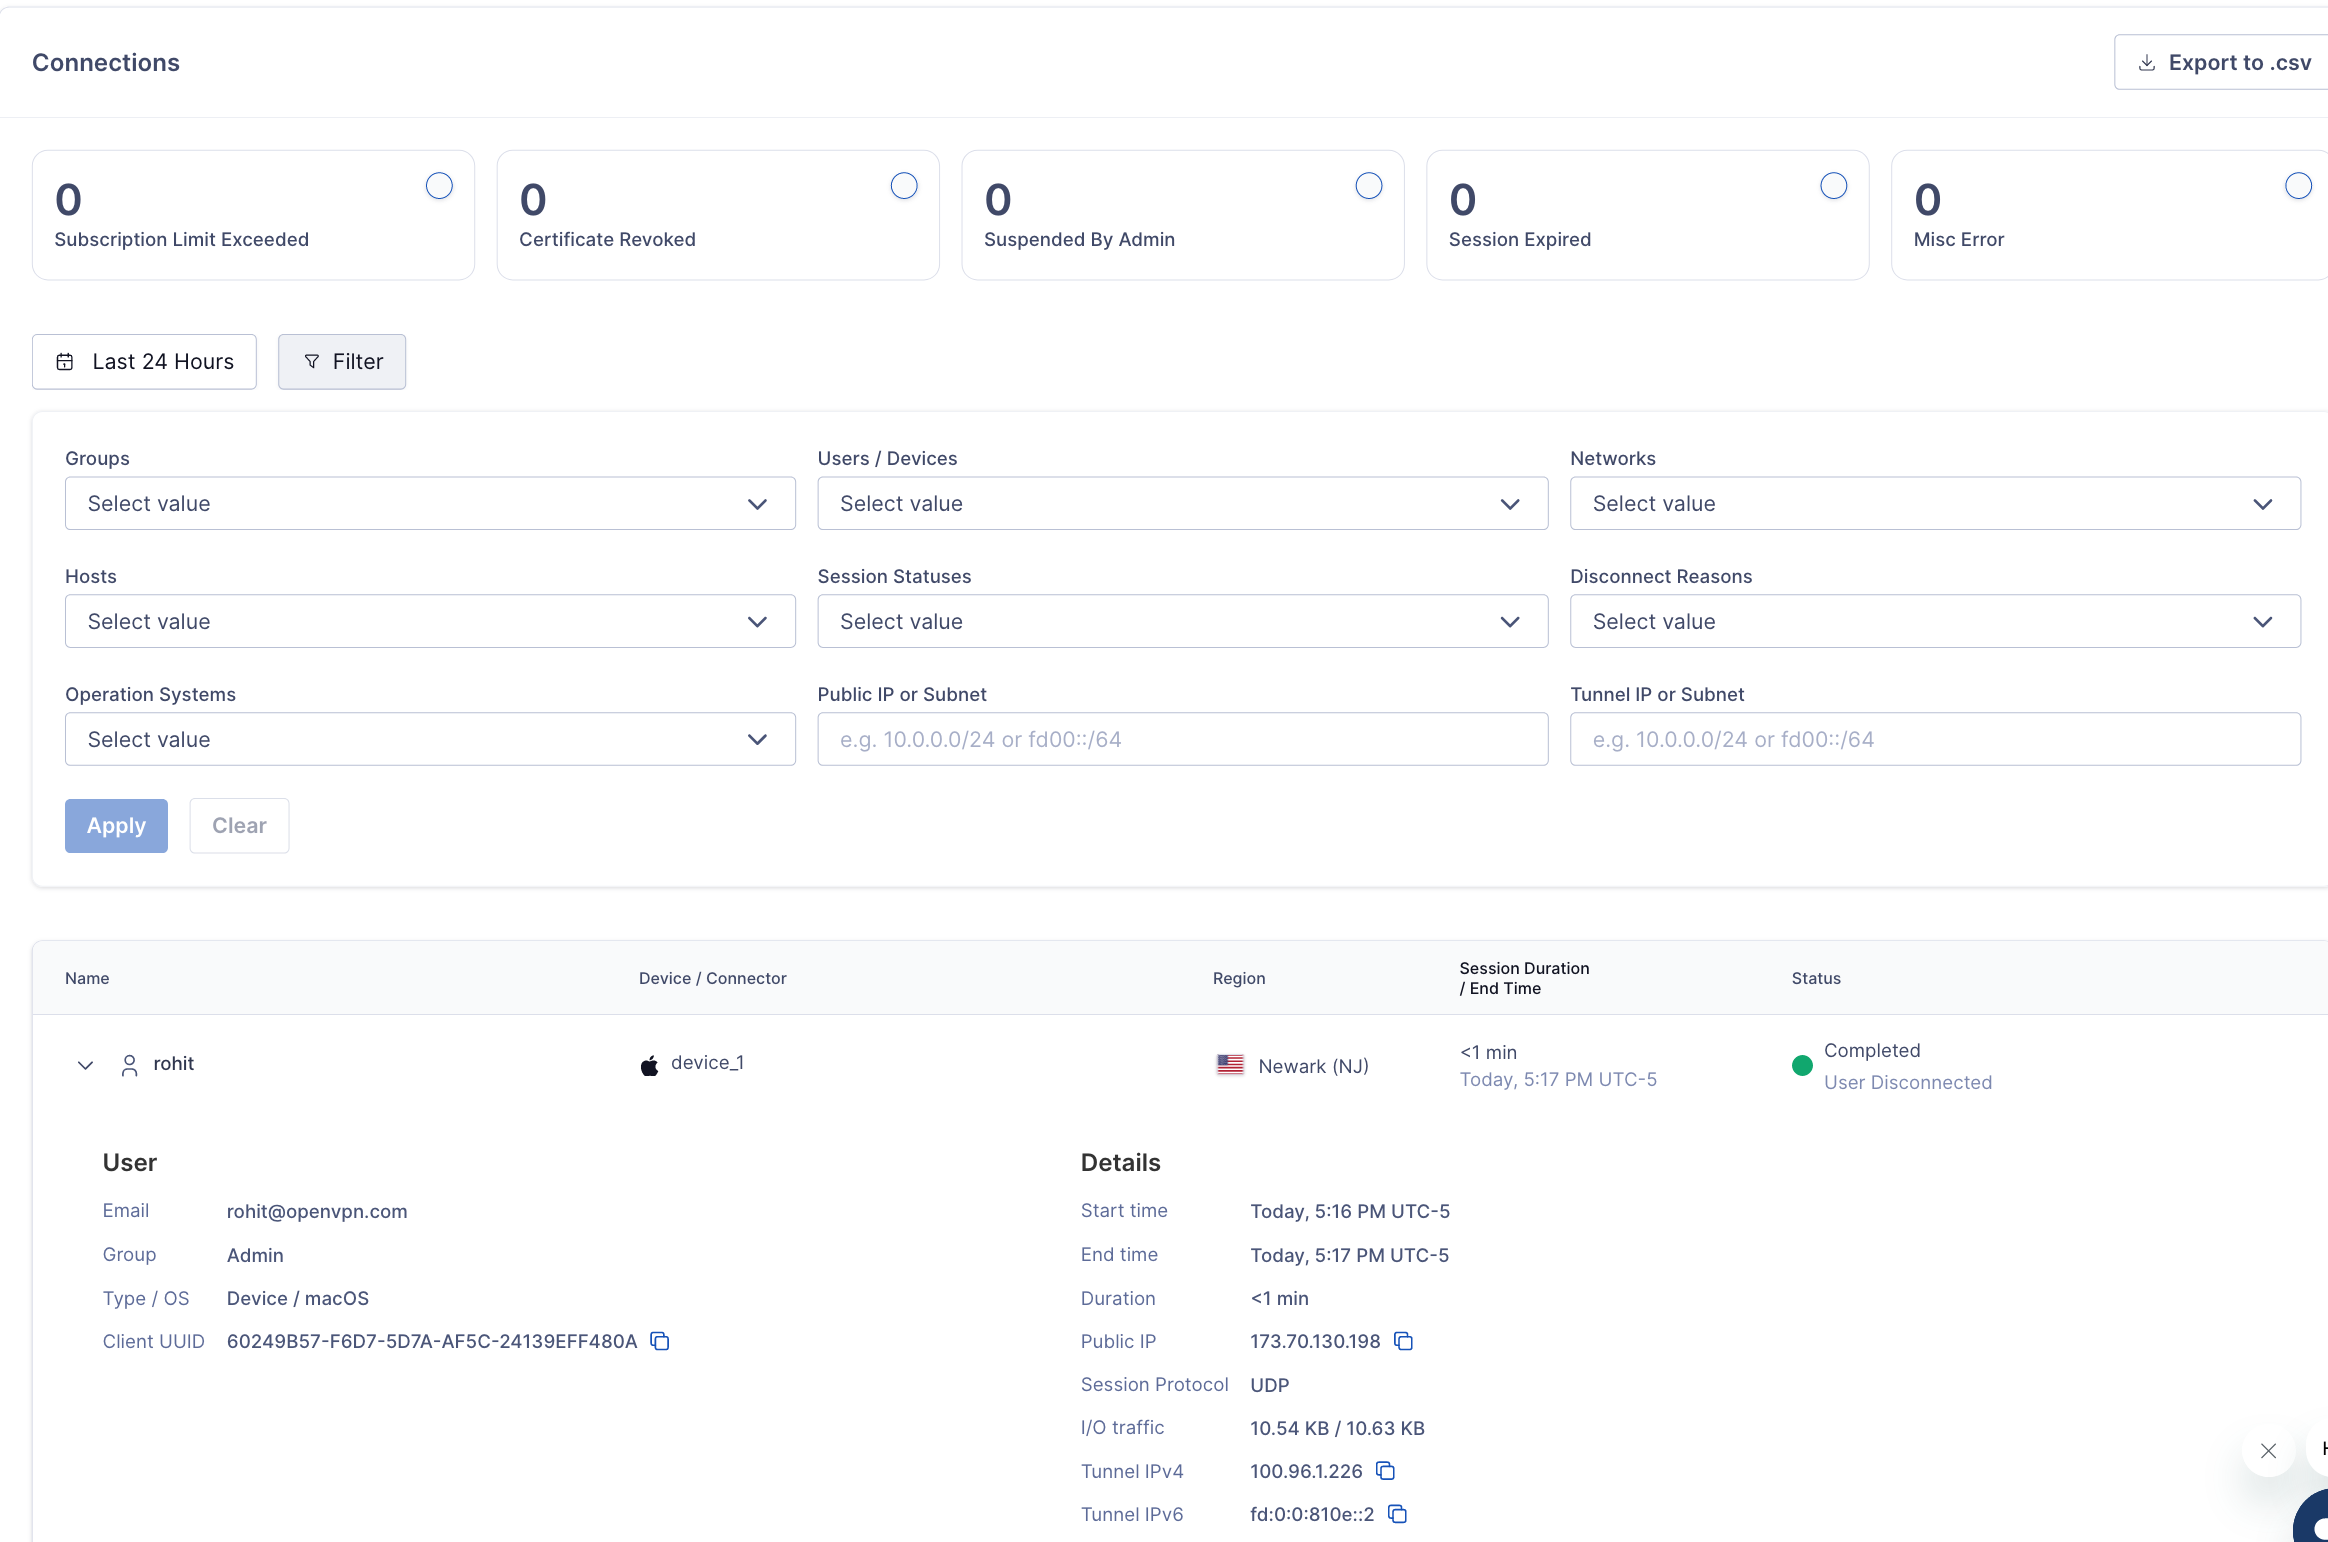
The Status section of the Administration portal provides comprehensive details of active, completed, and disconnected (due to errors) connections from Users, Networks, and Hosts for the last 30 days. The connection details are arranged in a table with columns that provide the User/Network/Host identity, Device/Connector identity, Region to which the connection was made, session duration and end timestamp, and the connection status with disconnect reason.
The Status section of the Administration portal provides comprehensive details of active, completed, and disconnected (due to errors) connections from Users, Networks, and Hosts for the last 30 days. The connection details are arranged in a table with columns that provide the User/Network/Host identity, Device/Connector identity, Region to which the connection was made, session duration and end timestamp, and the connection status with disconnect reason.
To get connection details, follow the steps below:
Login to your WPC's Administration portal by entering your WPC's Cloud ID in the address bar of your web browser. For example, [company_name].openvpn.com.
Navigate to the Status section.
Review the information provided in the Connections widget

Setting time range and using filters
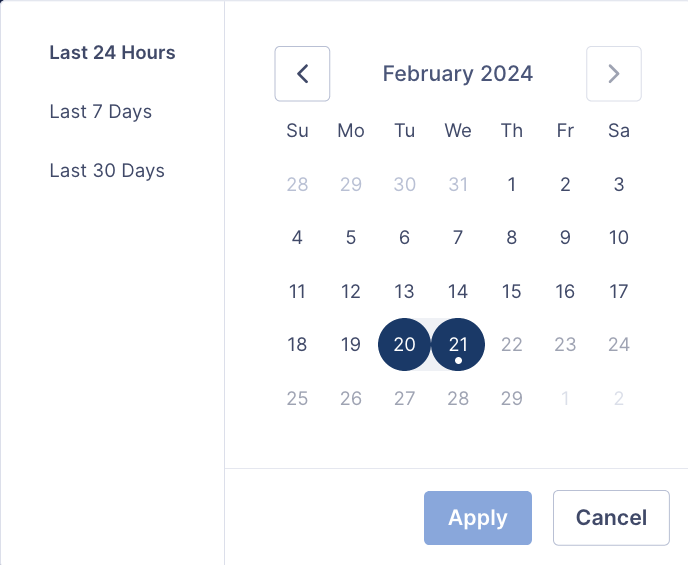
The time range is set to the last 24 hours by default. To change the time range, follow the steps below:
Click the time period quick filter
 icon.
icon.Select the time range from the expanded calendar.

Click Apply.
The table will show details of connections that occurred within the selected time range.
To further filter the displayed connections for a specific Network, Host, User Group, User/Device, Status, Disconnect Reason, Device's Operating System, public or tunnel IP address, carry out the following steps:
If the filter fields are collapsed, click the Filter
 icon to expand.
Specify the values of interest in the filter fields by selecting values from the drop-down lists or entering them in the text fields.
Click Apply.
The entries displayed will match the filter. If no entries are displayed, adjust your filters and try again.
Viewing details of a specific connection
Expand the specific connection row to see additional details by clicking on the expand  icon.
icon.
Additional details consist of:
User/Host/Network identity information
User Groups, if applicable. If the User belongs to multiple groups, the Primary User Group will be displayed with a number denoting the number of secondary groups. Hovering over the number will provide details of the Secondary User Groups.
Device Type and Operating System
Device UUID
Session Start Time
Session End Time
Session Duration
Public IP
Tunnel Session Protocl
Inbound/Outbound Traffic
Tunnel IPv4
Tunnel IPv6
Counts of connection errors
Counts above the connection details are shown to quickly identify disconnected sessions due to errors. The types of errors displayed are:
Subscription Limit Exceeded: This error is generated when a connection is disconnected because the count of active connections exceeds the subscribed number of connections if you are on a connection-limited pricing plan.
Certificate Revoked: This error is generated when the Administrator deletes an Active User’s Device, revokes that User’s Device Profile certificate deletes a Connector belonging to a Host/Network, or revokes that Connector’s Profile certificate.
Suspended By Admin: This error is generated when the Administrator has moved a User’s account state from Active to Suspended but has not deleted that User’s Device or revoked that User’s Device Profile certificate.
Session Expired: This error is generated when a connection is terminated because it has exceeded the Connection Timeout (set by default to 24 hours) but can be changed in Settings > Users. The Device will try to re-connect on disconnection.
Misc Error: This error is generated when a connection is terminated because it has encountered an error other than those specified above.
Filtering connections on termination error causes
The connections terminated due to errors can be quickly filtered based on the type of error by selecting and clearing the error type filter buttons. The error type buttons also show the connection count that matches that specific error type.

Exporting connection details to a CSV file
Click on the Export .csv  button on the top-right corner of the widget to receive an email with a time-bound link from which the CSV file can be downloaded.