Filter DNS log entries
DNS log entries can be filtered by checking their match against specific criteria.
DNS log entries can be filtered by checking their match against specific criteria. The data can be filtered to find specific domain names, resolved IP addresses, DNS query types, resolution statuses, as well as host/connector, network/connector, user/device, and user groups.
Note
All the filter criteria can be used together.
Filter by Domain Name
To filter the log entries by domain name, follow the steps below:
Navigate to API & Logs > DNS Log.
Set the date-range picker to the time period of interest: Last 24 hours, Last 7 days, Last 30 days, or a specific date interval. Click Apply.
If there were any logs for the chosen time interval, the time chart will display the day/hour and the number of allowed, blocked, and failed DNS requests made as a stacked bar chart.
If there were any logs for the chosen time interval, a table of log entries will be displayed below the chart.
Click
 .
.The drop-down will have eight options: Domain IP, DNS Query Type, DNS Resolution Status, Host / Connector, Network / Connector, Registered Domain (ARD), User / Device, User Group. If in the Resolved Subdomains view (Refer View DNS log entries for subdomains), the drop-down will show Full Domain Name instead of Registered Domain (ARD).
Figure 11. Screenshot of all filter criteria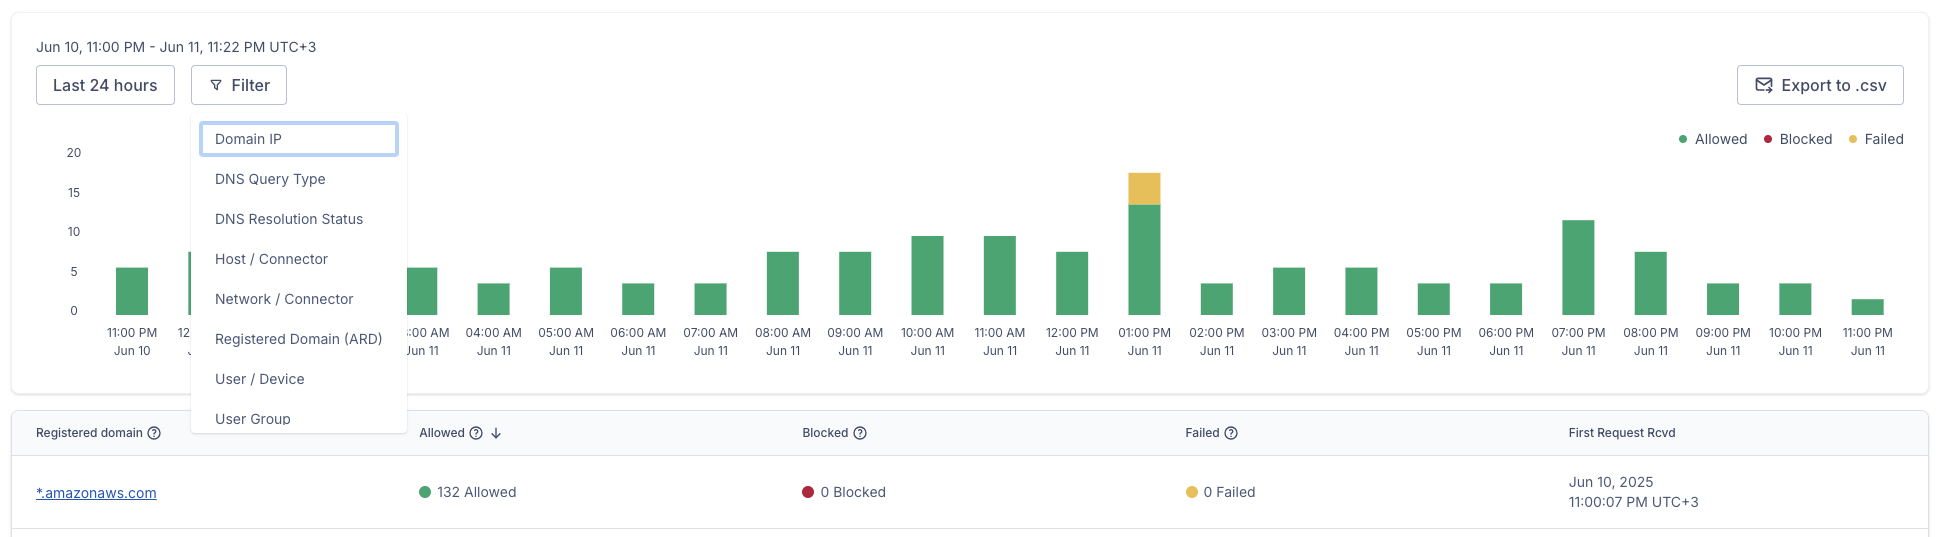
Click Registered Domain (ARD) from the drop-down or Full Domain Name if in the Resolved Subdomains view
Two criteria options will be shown: equals and starts with
Filter by domain name by choosing one of the options and providing a domain name value. Click Apply.
The set filter is displayed, and the log entries that match filter values are shown in the table.
Click X next to the displayed filter to reset it.
Filter by Domain IP
To filter the log entries by domain name, follow the steps below:
Navigate to API & Logs > DNS Log.
Set the date-range picker to the time period of interest: Last 24 hours, Last 7 days, Last 30 days, or a specific date interval. Click Apply.
If there were any logs for the chosen time interval, the time chart will display the day/hour and the number of DNS requests made.
If there were any logs for the chosen time interval, a table of log entries will be displayed below the chart.
Click
.The drop-down will have eight options: Domain IP, DNS Query Type, DNS Resolution Status, Host / Connector, Network / Connector, Registered Domain (ARD), User / Device, User Group. If in the Resolved Subdomains view (Refer View DNS log entries for subdomains), the drop-down will show Full Domain Name instead of Registered Domain (ARD).
Figure 12. Screenshot of all filter criteriaClick Domain IP from the drop-down
A Domain IP equals text box will appear
Provide the full IPv4 or IPv6 IP address in the text box and click Apply.
The set filter is displayed, and the log entries that match filter values are shown in the table.
Click X next to the displayed filter to reset it.
Filter by DNS Query Type
To filter the log entries by DNS query type, follow the steps below:
Navigate to API & Logs > DNS Log.
Set the date-range picker to the time period of interest: Last 24 hours, Last 7 days, Last 30 days, or a specific date interval. Click Apply.
If there were any logs for the chosen time interval, the time chart will display the day/hour and the number of DNS requests made.
If there were any logs for the chosen time interval, a table of log entries will be displayed below the chart.
Click
.The drop-down will have eight options: Domain IP, DNS Query Type, DNS Resolution Status, Host / Connector, Network / Connector, Registered Domain (ARD), User / Device, User Group. If in the Resolved Subdomains view (Refer View DNS log entries for subdomains), the drop-down will show Full Domain Name instead of Registered Domain (ARD).
Figure 13. Screenshot of all filter criteriaClick DNS Query Type from the drop-down
The options in and not in will appear.
Select an option.
A list with known DNS query types will appear.
Select one or more record types from the list. Alternatively, you can also use the search bar to find a record type.
Figure 14. Screenshot of the DNS record types filter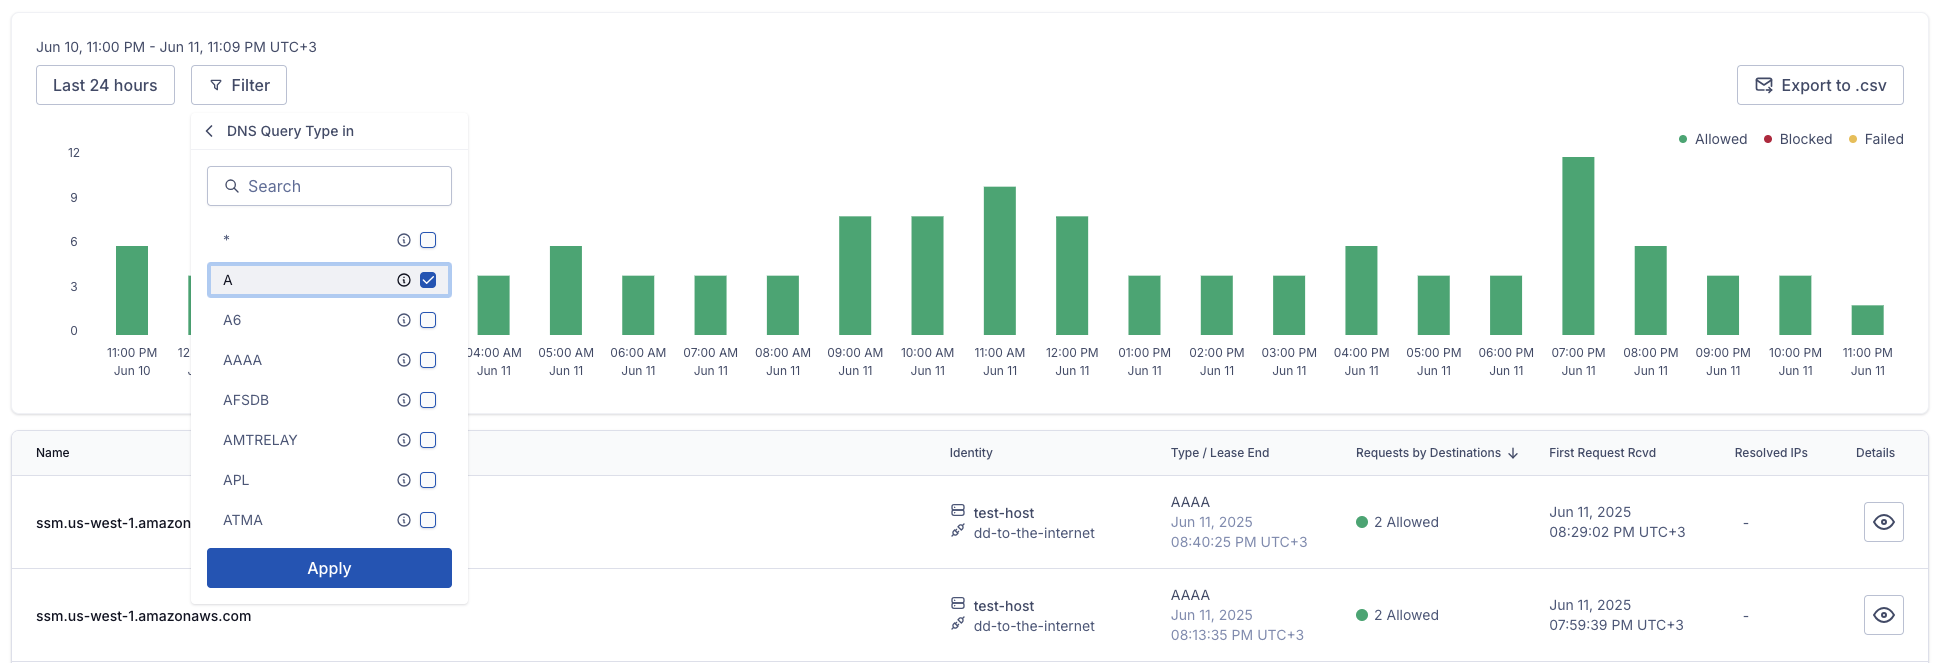
Click Apply.
The set filter is displayed, and the log entries that match filter values are shown in the table.
Figure 15. Screenshot of the filtered list
Click X next to the displayed filter to reset it.
Filter by DNS Resolution Status
To filter the log entries by DNS resolution status, follow the steps below:
Navigate to API & Logs > DNS Log.
Set the date-range picker to the time period of interest: Last 24 hours, Last 7 days, Last 30 days, or a specific date interval. Click Apply.
If there were any logs for the chosen time interval, the time chart will display the day/hour and the number of DNS requests made.
If there were any logs for the chosen time interval, a table of log entries will be displayed below the chart.
Click
.The drop-down will have eight options: Domain IP, DNS Query Type, DNS Resolution Status, Host / Connector, Network / Connector, Registered Domain (ARD), User / Device, User Group. If in the Resolved Subdomains view (Refer View DNS log entries for subdomains), the drop-down will show Full Domain Name instead of Registered Domain (ARD).
Figure 16. Screenshot of all filter criteriaClick DNS Resolution Status from the drop-down.
The options in and not in will appear.
Select an option
A list with known DNS resolution statuses will appear.
Select one or more statuses from the list. Alternatively, you can also use the search bar to find a status.
Click Apply.
The set filter is displayed, and the log entries that match filter values are shown in the table.
Click X next to the displayed filter to reset it.
Filter by User Group
To filter the log entries by User Group, follow the steps below:
Navigate to API & Logs > DNS Log.
Set the date-range picker to the time period of interest: Last 24 hours, Last 7 days, Last 30 days, or a specific date interval. Click Apply.
If there were any logs for the chosen time interval, the time chart will display the day/hour and the number of allowed, blocked, and failed DNS requests made as a stacked bar chart.
If there were any logs for the chosen time interval, a table of log entries will be displayed below the chart.
Click
.The drop-down will have eight options: Domain IP, DNS Query Type, DNS Resolution Status, Host / Connector, Network / Connector, Registered Domain (ARD), User / Device, User Group. If in the Resolved Subdomains view (Refer View DNS log entries for subdomains), the drop-down will show Full Domain Name instead of Registered Domain (ARD).
Figure 17. Screenshot of all filter criteriaClick User Group from the drop-down.
The options in and not in will appear.
Select an option.
A list of User Groups will appear.
Select one or more User Groups and click Apply.
The set filter is displayed, and the log entries that match filter values are shown in the table.
Click X next to the displayed filter to reset it.
Filter by User/Device
To filter the log entries by User/Device, follow the steps below:
Navigate to API & Logs > DNS Log.
Set the date-range picker to the time period of interest: Last 24 hours, Last 7 days, Last 30 days, or a specific date interval. Click Apply.
If there were any logs for the chosen time interval, the time chart will display the day/hour and the number of allowed, blocked, and failed DNS requests made as a stacked bar chart.
If there were any logs for the chosen time interval, a table of log entries will be displayed below the chart.
Click
.The drop-down will have eight options: Domain IP, DNS Query Type, DNS Resolution Status, Host / Connector, Network / Connector, Registered Domain (ARD), User / Device, User Group. If in the Resolved Subdomains view (Refer View DNS log entries for subdomains), the drop-down will show Full Domain Name instead of Registered Domain (ARD).
Figure 18. Screenshot of all filter criteriaClick User/Device from the drop-down.
A list of Users will appear. There will be an option to expand the drop-down and see devices for the User.
Select one or more Users or Devices and click Apply.
The set filter is displayed, and the log entries that match filter values are shown in the table.
Click X next to the displayed filter to reset it.
Filter by Host/Connector
To filter the log entries by Host/Connector, follow the steps below:
Navigate to API & Logs > DNS Log.
Set the date-range picker to the time period of interest: Last 24 hours, Last 7 days, Last 30 days, or a specific date interval. Click Apply.
If there were any logs for the chosen time interval, the time chart will display the day/hour and the number of DNS requests made.
If there were any logs for the chosen time interval, a table of log entries will be displayed below the chart.
Click
.The drop-down will have eight options: Domain IP, DNS Query Type, DNS Resolution Status, Host / Connector, Network / Connector, Registered Domain (ARD), User / Device, User Group. If in the Resolved Subdomains view (Refer View DNS log entries for subdomains), the drop-down will show Full Domain Name instead of Registered Domain (ARD).
Figure 19. Screenshot of all filter criteriaClick Host/Connector from the drop-down.
A list of Hosts will appear. There will be an option to expand the drop-down and see Connectors.
Figure 20. Screenshot of Host/Connector selection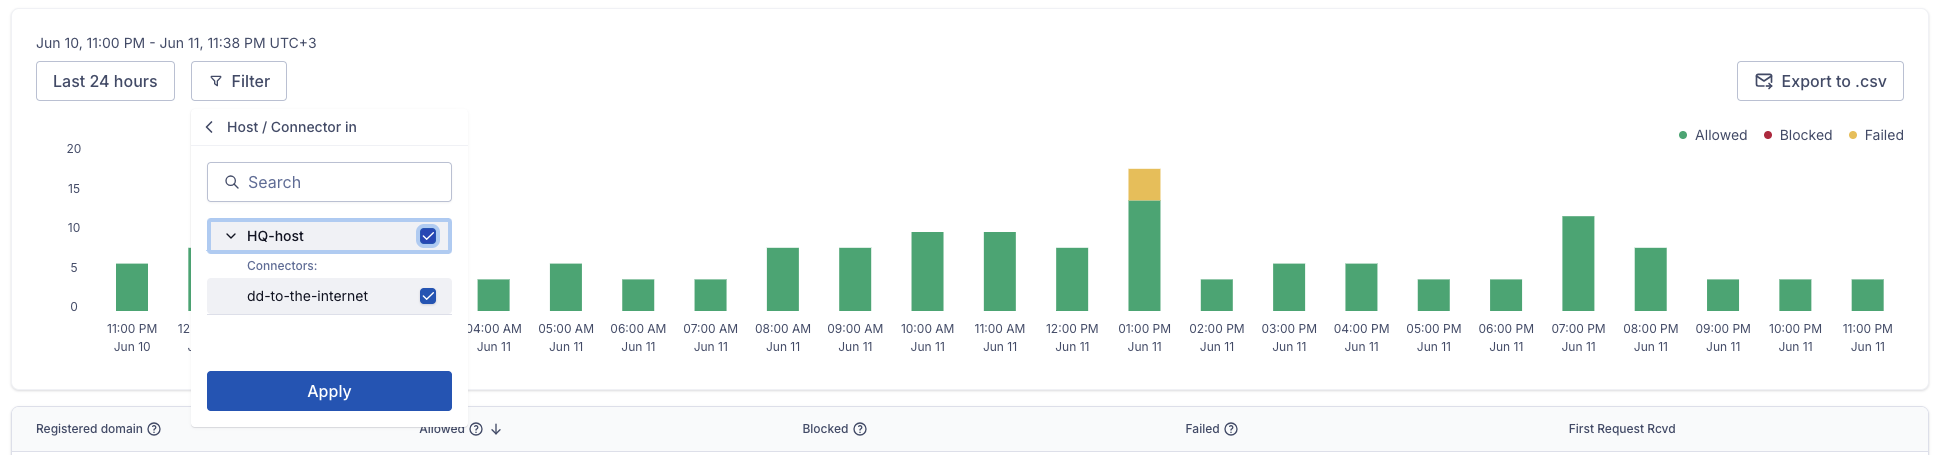
Select one or more Hosts/Connectors and click Apply.
The set filter is displayed, and the log entries that match filter values are shown in the table.
Click X next to the displayed filter to reset it.
Filter by Network/Connector
To filter the log entries by Network/Connector, follow the steps below:
Navigate to API & Logs > DNS Log.
Set the date-range picker to the time period of interest: Last 24 hours, Last 7 days, Last 30 days, or a specific date interval. Click Apply.
If there were any logs for the chosen time interval, the time chart will display the day/hour and the number of DNS requests made.
If there were any logs for the chosen time interval, a table of log entries will be displayed below the chart.
Click
.The drop-down will have eight options: Domain IP, DNS Query Type, DNS Resolution Status, Host / Connector, Network / Connector, Registered Domain (ARD), User / Device, User Group. If in the Resolved Subdomains view (Refer View DNS log entries for subdomains), the drop-down will show Full Domain Name instead of Registered Domain (ARD).
Figure 21. Screenshot of all filter criteriaClick Network/Connector from the drop-down.
A list of Networks will appear. There will be an option to expand the drop-down and view Connectors.
Select one or more Networks/Connectors and click Apply.
The set filter is displayed, and the log entries that match filter values are shown in the table.
Click X next to the displayed filter to reset it.