Status
The Status section of the Admin Web UI provides an overview of your VPN services and configuration, a list of current users, and log reports.
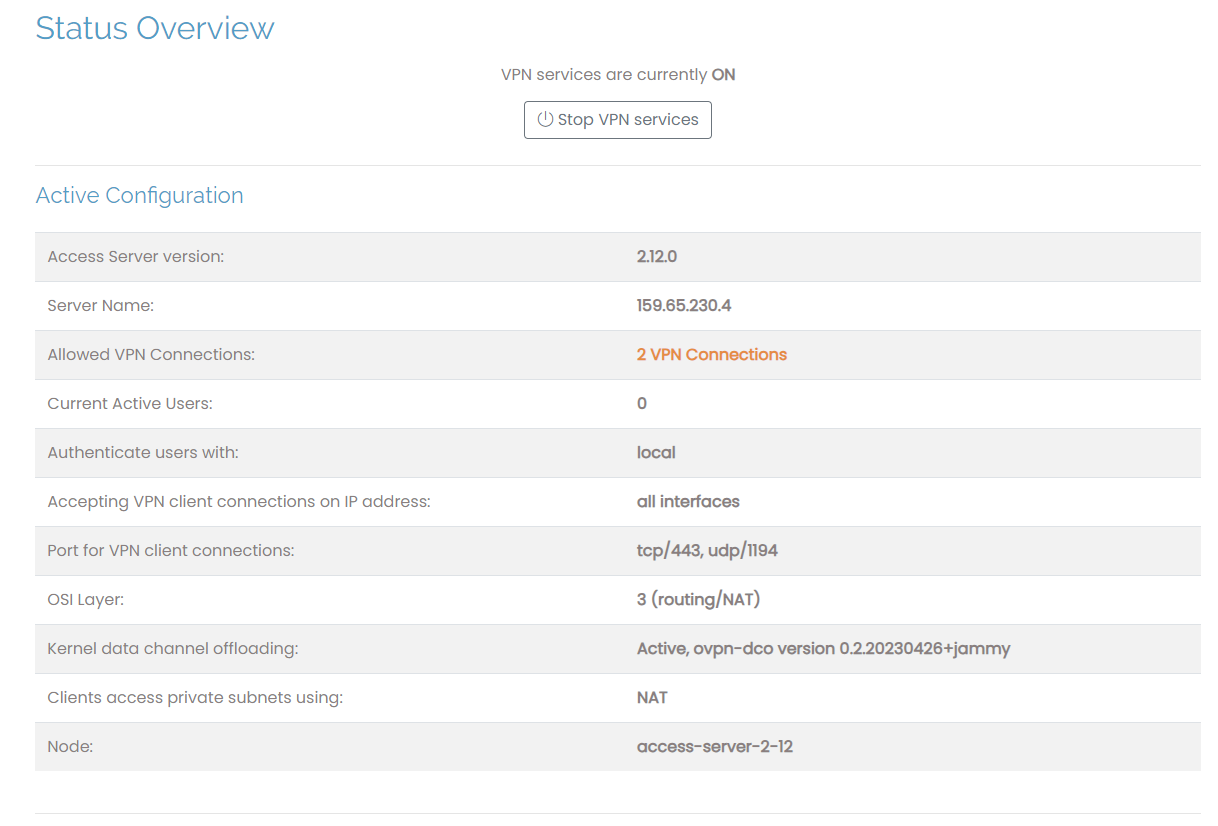
Each time you sign into the Admin Web UI, you start on the landing page, Status Overview. This page displays information regarding your active Access Server configuration. You also have the choice to stop the server by clicking Stop the Server.
Active Configuration
This section provides relevant information on the current Access Server status.
Access Server version: The current version of your Access Server product.
Server Name: The server URL or the IP address.
Allowed VPN Connections: The allowed VPN connections based on your subscription.
Current Active Users: The current active connections from clients.
Authenticate Users With: The default user authentication: local, PAM, RADIUS, LDAP, SAML, or PASOnly.
Accepting VPN Client Connections on IP Address: The IP address or domain for client connections.
Port for VPN Client Connections: The TCP and UDP ports.
OSI Layer: The layer for open systems intercommunication (OSI) with the default being 3.
Clients Access Private Subnets Using: Displays the method for remapping IP addresses.
Node: The general Access Server name, or the name of the individual node if the server is configured as a cluster of nodes.
Documentation
This section provides links to Access Server documentation. Topics include Clustering, Configuration, Command line, and Client Connection.
Under Status Overview is Current Users. Clicking on this takes you to a landing page that displays a table with information about the users currently connected to your Access Server in real-time.
Current Users
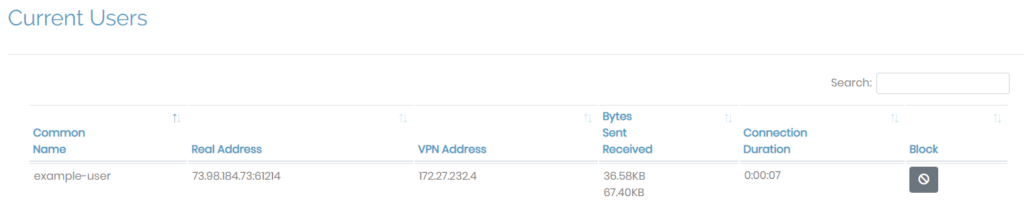
The table headers reference the relevant information about the user(s) currently connected.
The arrows above each header allow you to sort the columns in ascending or descending order. The search box allows you to filter the table by inputting any valid parameter. All search parameters (those relative to the headers) are valid.
Common Name: The name of the user currently connected to Access Server.
Real Address: The IP address of the device connected to the address server.
VPN Address: The address assigned by the VPN to the user — local to the VPN.
Bytes Sent/Received: The total bytes sent or received from the connected device.
Connection Duration: The amount of time the user has been connected to Access Server for their active session.
Block: Displays whether the specified user has access to Access Server; you can press the button to block the user.
The Log Reports provides an easy form to query the history of clients who have connected to Access Server.
Query by Start Time
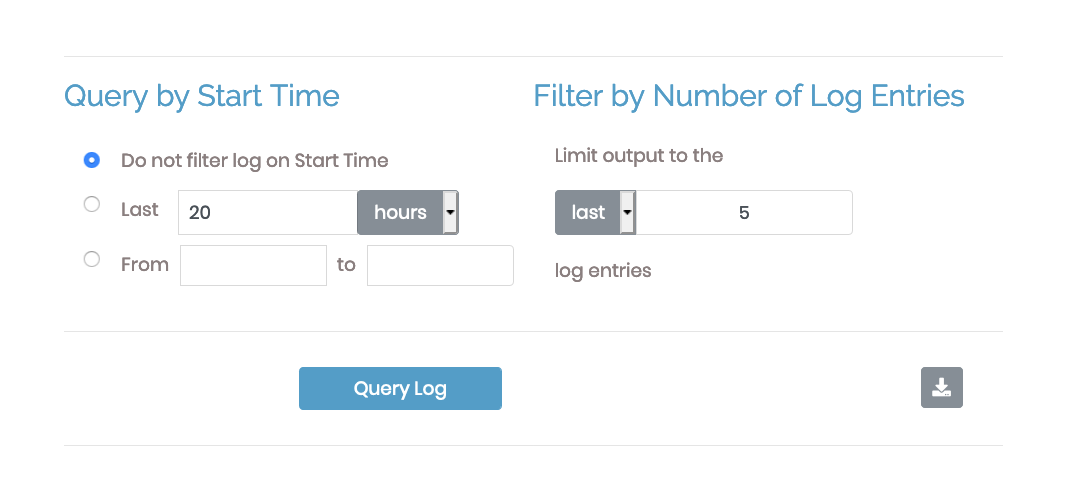
At the top-left, under Query by Start Time, you can query the log using a time range with these three options:
Do not filter log on Start Time: No filtering via start time.
Last ___ hours: Search for entries in the last specified hours, days, or minutes by defining the time, then using the drop-down menu (default is hours) to query by days, hours, or minutes.
From ___ to ___: Define a time interval that ranges from the specified hours of the current day. For example, a user can query all logs submitted between 11:00 and 20:30. This generates all logs recorded between those times.
Filter by Number of Log Entries
At the top-right, under Filter by Number of Log entries, you can limit the logs returned and query by earliest or latest entries. Use the drop-down menu to choose first (earliest) or last (latest). You can then display the results on the screen by clicking Query Log or download as a CSV by clicking the download button.
Query Results
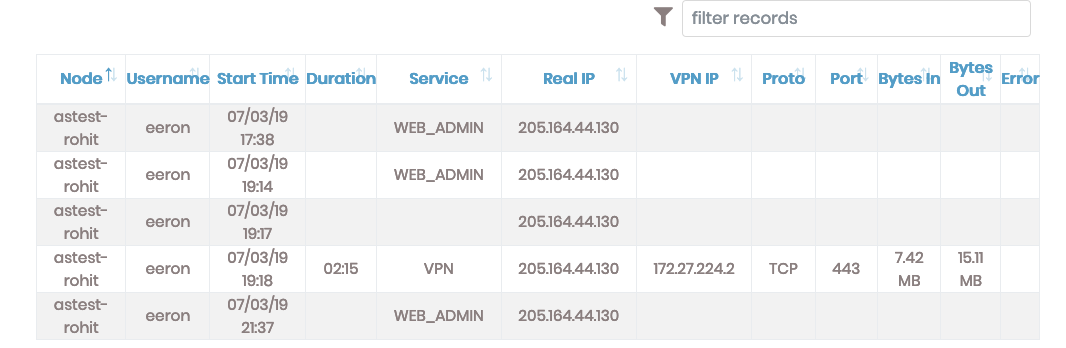
Your query results include the following columns:
Node: The general Access Server name.
User Name: The identity of the user attempting to connect.
Start Time: The date when the request was made.
Duration: The amount of time the user was connected.
Service: The type of user connecting — Admin = WEB_ADMIN; Client = VPN.
Real IP: The IP address of the user.
VPN IP: The IP address assigned by the VPN to the user.
Proto: The protocol used for the connection: TCP or UDP.
Port: The port used to complete the request.
Bytes In: The amount of data received from the user.
Bytes Out: The amount of data sent to the user.
Error: The message detailing why a user couldn't connect. This is blank for successful connections.
Sorting and Filtering Query Results
The headers of the table contain arrows for sorting the entries in ascending or descending order. You can add additional filters to the query by inputting valid search parameters into the filter records field.
The query filters as you type characters in this field. To remove the filter and display all of the original result set, delete all characters or enter only a space.
Logging Disabled
You can turn off Access Server logging by editing the as.conf file. When turned off, Access Server no longer records logs that can help with troubleshooting should any issues arise.
When logging is off, Access Server displays, "logging disabled in as.conf."